Recompute and act on at-risk learners
A transparent score from attendance, grades, engagement and wellbeing, an optional AI explanation, and a case in one click.
Flow
An explainable score
Diagram: An explainable score. Steps:
- Attendance
- Grades
- Engagement
- Wellbeing
- Score 0–100, formula in code
- Band: Low / Medium / High
- Explain why (AI) — anonymised factors only
- Create case
- Pastoral case with the factor summary
Connections:
- Attendance → Score 0–100, formula in code
- Grades → Score 0–100, formula in code
- Engagement → Score 0–100, formula in code
- Wellbeing → Score 0–100, formula in code
- Score 0–100, formula in code → Band: Low / Medium / High
- Band: Low / Medium / High → Explain why (AI) — anonymised factors only
- Band: Low / Medium / High → Create case
- Create case → Pastoral case with the factor summary
Pallara does thisStaff action
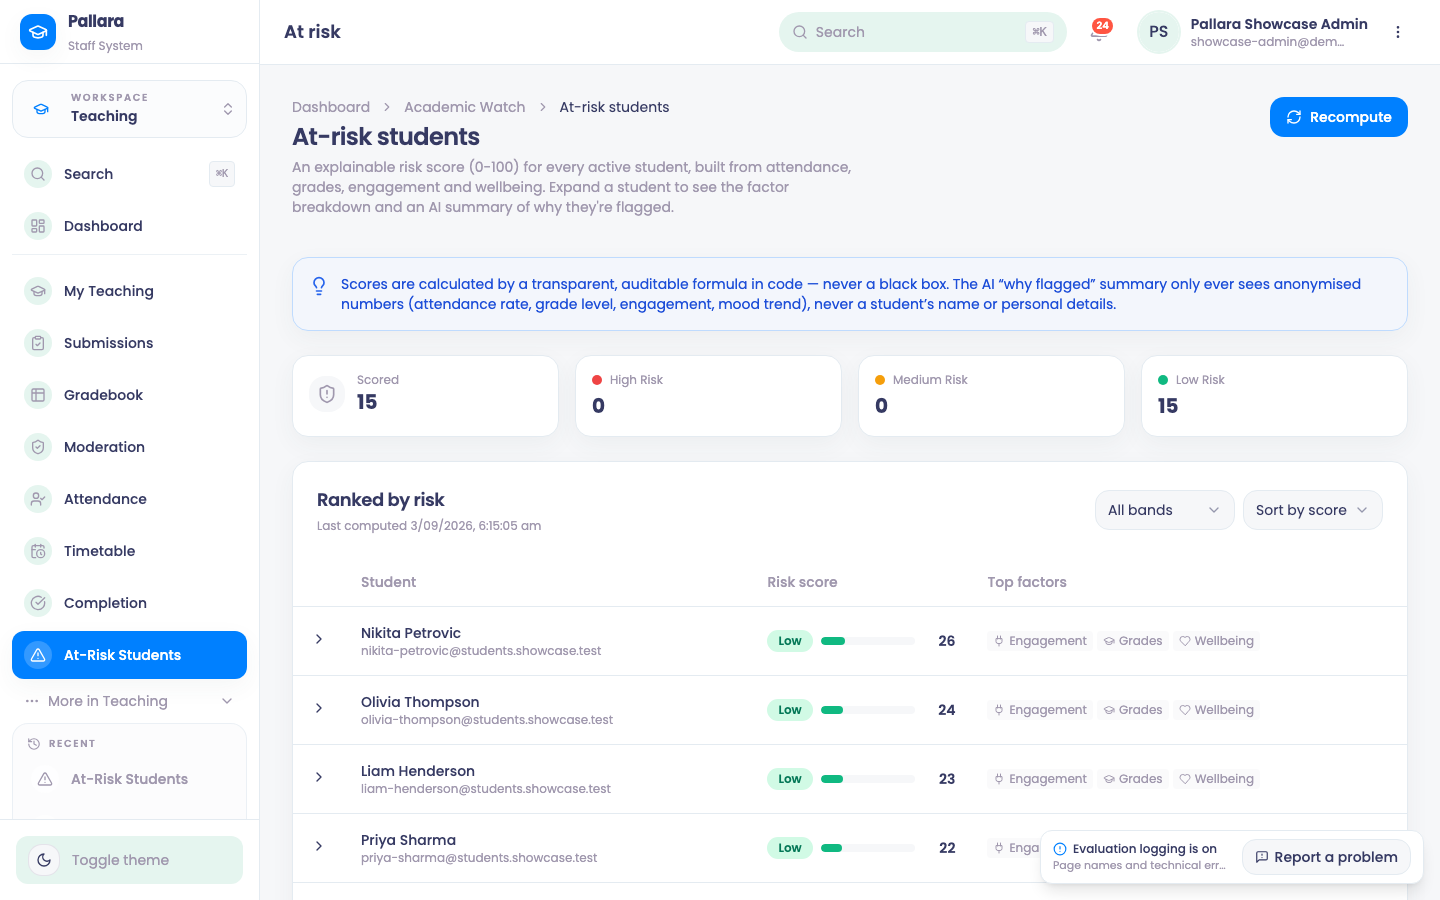
- Open Teaching → At-Risk Students and select Recompute. The page covers active learners only; graduated and inactive learners are not in its counts.
- Use the band menu to focus on High, Medium or Low risk, and sort by score or name. An empty band says No students to show.
- Select a learner row to expand it. Four contribution bars — Attendance, Grades, Engagement, Wellbeing — show what is driving the score, with their points and the detail behind each.
- Select Explain why (AI) for a plain-language Why flagged and Suggested action. The AI receives only the anonymised score factors, never the learner's record.
- Select Create case. The button becomes Case opened and an ordinary pastoral case exists in Learner services → Cases, with the factor summary as its first note.
Was this guide helpful?